Weather Reports From Mars
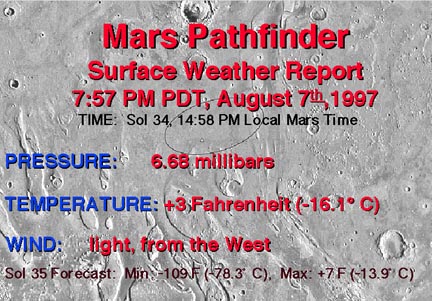
| Surface Weather Report - Sol 26, 2:36 pm Mars Time (30 July 1997) |
| Pressure |
Temperature |
Wind |
| 6.71 millibars |
+8 F (-13.3 C) |
Light, from the West |
| Sol 27 Forecast: Min: -109 F (-78.3 C), Max: +7 F (-13.9 C) |
| Surface Weather Report - Sol 23, 2:12 pm Mars Time (27 July 1997) |
| Pressure |
Temperature |
Wind |
| 6.70 millibars |
+9 F (-12.8 C) |
From the West |
| Sol 24 Forecast: Min: -109 F (-78.3 C), Max: +8 F (-13.3 C) |
| Surface Weather Report - Sol 18, 12:47 pm Mars Time (22 July 1997) |
| Pressure |
Temperature |
Wind |
| 6.79 millibars |
-11 F (-23.9 C) |
From the Southwest |
| Sol 19 Forecast: Min: -107 F (-77.2 C), Max: +4 F (-15.5 C) |
| Surface Weather Report - Sol 14, 6:34 am Mars Time (17 July 1997) |
| Pressure |
Temperature |
Wind |
| 6.70 millibars |
-89 F (-67.2 C) |
From the Northeast |
| Sol 15 Forecast: Min: -99 F (-72.8 C), Max: +9 F (-12.8 C) |
| Surface Weather Report - Sol 12, 6:35 am Mars Time (16 July 1997) |
| Pressure |
Temperature |
Wind |
| 6.71 millibars |
-89 F (-67.2 C) |
From the Northwest |
| Sol 13 Forecast: Min: -100 F (-76.3 C), Max: +7 F (-13.9 C) |
| Surface Weather Report - Sol 10, 11:51 am Mars Time (14 July 1997) |
| Pressure |
Temperature |
Wind |
| 6.74 millibars |
-9 F (-22.8 C) |
From the West-Northwest |
| Sol 12 Forecast: Min: -100 F (-76.3 C), Max: +7 F (-13.9 C) |
| Surface Weather Report - Sol 8, 12:17 pm Mars Time (12 July 1997) |
| Pressure |
Temperature |
Wind |
| 6.74 millibars |
-8 F (-22.2 C) |
From the West |
| Sol 10 Forecast: Max: +8 F (-13.3 C) |
| Surface Weather Report - Sol 6, 2:55 pm Mars Time (10 July 1997) |
| Pressure |
Temperature |
Wind |
| 6.76 millibars |
+8 F (-13 C) |
From the West |
| Sol 8 Forecast: Min: -103 F (-75 C) |
| Surface Weather Report - Sol 5, 2:41 pm Mars Time (9 July 1997) |
| Pressure |
Temperature |
Wind |
| 6.77 millibars |
-1 F (-18 C) |
From the West |
| Sol 6 Forecast: Min: -104 F (-75.5 C) |
|
Dr. Tim Schofield, JPL
Atmospheric Structure/Meteorology Package Team Leader
|
 Measured surface pressure
ss034.gif
 |
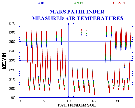 Measured air temperatures
ss035.gif
 |
Surface pressure, in units of millibars, measured
by the Mars Pathfinder lander on the Martian surface. Oscillations in measured
pressure during a day are caused by the warming/expansion of the atmosphere
which follows the sun around the planet and the cooling/contraction which
follows the night. Similar atmospheric processes occur on Earth. We interpret
the observed variations to indicate the presence of suspended dust over
a large portion of the planet and mixed upwards to several tens of kilometers
in depth. We resumed complete diurnal coverage with our meteorology measurements
at 7 AM on Sol 18, following the successful uplink of a flight software
patch.
We believe we have seen the minimum annual daily-averaged
pressure at the landing site, which apparently occurred on either sol 14,
15 or 16. Our lack of complete diurnal coverage makes this estimation a
bit uncertain. We had predicted that the minimum would occur between sols
15-20 of the mission (I erred several days ago in saying we expected an
additional 15 sols of decline before reaching the minimum). Our estimate
was based upon Viking lander 1 measurements from 1976-1982 and upon results
from numerical models. The data shown in this and the additional three ASI/MET
plots span the time from landing ( ~3 AM on Sol 1) through our most recent
data (2:12 PM PM on Sol 23). |
Martian air temperature, in Kelvin ( 200 Kelvin =
-100 Fahrenheit; 260 Kelvin = +8 Fahrenheit), measured by the three thermocouples
(electronic temperature measuring devices) located at different heights
on the Mars Pathfinder ASI/MET mast. The top mast thermocouple is located
one meter above the outer edge of one of Pathfinders' three solar panels.
The top of the solar panel is 0.4 meters (16 inches) above the martian surface,
which puts the top mast thermocouple 1.4 meters (55 inches) above the surface.
The middle mast thermocouple is located 0.5 meters above the solar panel;
the bottom thermocouple at 0.25 meters. Since air temperature generally
decreases with increasing distance from the sun-warmed ground during daylight
hours, the bottom mast thermocouple measures the warmest temperature at
those times of day. During the night, the ground rapidly cools and air temperatures
are coldest nearest the ground. Thus, at night, the top mast thermocouple
measures the warmest temperature. |
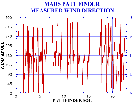 Measured wind direction
ss036.gif
 |
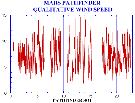 Qualitative wind speed
ss037.gif
 |
| Wind direction at the Mars Pathfinder site is indicated
as the direction from which the wind is coming: i.e. a southerly wind is
a wind from the south. During the initial sols of the mission, wind direction
rotated in a clockwise manner with time: southerly at night, westerly in
the morning, northerly during early afternoon, and from the east in the
evening. Winds from the south at night are consistent with flow down the
Ares Valley at whose northern end Pathfinder is located. The change in the
daily wind variation seen to begin late on sol 7 occurs in conjunction with
a decrease in the measured sol averaged surface pressure and modulation
to its diurnal cycle. Subsequently, we have seen a return to winds rotating
through a full 360 degrees during the course of a sol. |
Wind speeds have still not been absolutely determined
from the signals we are receiving from the wind sensor located at the top
of the ASI/MET mast. However, our wind sensor signals are strong, and do
provide some qualitative information about wind speed (i.e., largest signal
as indictaed in this plot corresponds to the fastest winds,...). During
the mission's initial 10 sols, winds were strong during early morning hours.
The time around noon also was a preferred time for relatively strong winds.
Weakest winds occur during late afternoon/early evening on most sols. This
general pattern of early morning maximum winds has persisted, as far as
we can determine from our incomplete diurnal coverage, through to Sol 23.
We continue to work towards producing the wind speed data set, and will
put the data on this web page as soon as it is available. |
 Measured surface pressure
ss026.gif
 |
 Measured air temperatures
ss027.gif
 |
| Surface pressure, in units of millibars, measured
by the Pathfinder lander on the martian surface. Oscillations in measured
pressure during a day are caused by the warming/expansion of the atmosphere
which follows the sun around the planet and the cooling/contraction which
follows the night. Similar atmospheric processes occur on Earth. We interpret
the observed variations to indicate the presence of suspended dust over
a large portion of the planet and mixed upwards to several tens of kilometers
in depth. We expect the decline in the daily averaged pressure to continue
for another 10-15 sols, after which we expect the pressure to slowly increase.
We hope to resume sampling of the full diurnal cycle beginning the afternoon
of Sol 15 (Saturday, July 19, 1997), following uplink to the spacecraft
of a software patch to minimize the risk of a spacecraft reset. |
Martian air temperature, in Kelvin ( 200 Kelvin =
-100 Fahrenheit; 260 Kelvin = +8 Fahrenheit), measured by the three thermocouples
(electronic temperature measuring devices) located at different heights
on the Mars Pathfinder ASI/MET mast. The top mast thermocouple is located
one meter above the outer edge of one of Pathfinder's three solar panels.
The top of the solar panel is 0.4 meters (16 inches) above the Martian surface,
which puts the top mast thermocouple 1.4 meters (55 inches) above the surface.
The middle mast thermocouple is located 0.5 meters above the solar panel;
the bottom thermocouple at 0.25 meters. Since air temperature generally
decreases with increasing distance from the sun-warmed ground during daylight
hours, the bottom mast thermocouple measures the warmest temperature at
those times of day. During the night, the ground rapidly cools and air temperatures
are coldest nearest the ground. Thus, at night, the top mast thermocouple
measures the warmest temperature. |
 Measured wind direction
ss028.gif
 |
 Qualitative wind speed
ss029.gif
 |
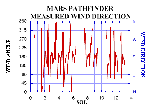
| Wind direction at the Mars Pathfinder site is indicated
as the direction from which the wind is coming: i.e. a southerly wind is
a wind from the south. During the initial sols of the mission, wind direction
rotated in a clockwise manner with time: southerly at night, westerly in
the morning, northerly during early afternoon, and from the east in the
evening. Winds from the south at night are consistent with flow down the
Ares Valley at whose northern end Pathfinder is located. The change in the
daily wind variation seen to begin late on sol 7 occurs in conjunction with
a decrease in the measured sol averaged surface pressure and modulation
to its diurnal cycle. Subsequent wind directions suggest that this new patterndoes
not persist, but the lack of full diurnal coverage makes any interpretation
premature. We look forward to resumption of full diurnal coverage of meteorological
observations on Sol 15. |
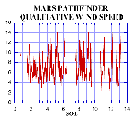
Wind speeds have still not been absolutely determined
from the signals we are receiving from the wind sensor located at the top
of the ASI/MET mast. However, our wind sensor signals are strong, and do
provide some qualitative information about wind speed (i.e., when are the
winds apparently strongest,...). During the mission's initial 10 sols, winds
were strong during early morning hours. The time around noon also was a
preferred time for relatively strong winds. Weakest winds occur during late
afternoon/early evening on most sols. We continue to work towards producing
the wind speed data set, and will put the data on this web page as soon
as it is available. |
|
 Measured air temperatures
ss017.jpg
 |
 Measured surface pressure
ss018.jpg
 |
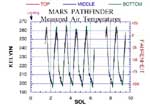
| Martian air temperature, in Kelvin (200 Kelvin = -100
Fahrenheit; 260 Kelvin = +8 Fahrenheit), measured by the three thermocouples
(electronic temperature measuring devices) located at different heights
on the Mars Pathfinder ASI/MET mast. The top mast thermocouple is located
one meter above the outer edge of one of Pathfinder's three solar panels.
The top of the solar panel is 0.4 meters (16 inches) above the martian surface,
which puts the top mast thermocouple 1.4 meters (55 inches) above the surface.
The middle mast thermocouple is located 0.5 meters above the solar panel;
the bottom thermocouple at 0.25 meters. Since air temperature generally
decreases with increasing distance from the sun-warmed ground during daylight
hours, the bottom mast thermocouple measures the warmest temperature at
those times of day. During the night, the ground rapidly cools and air temperatures
are coldest nearest the ground. Thus, at night, the top mast thermocouple
measures the warmest temperature. |
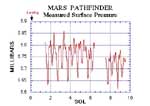
Surface pressure, in units of millibars, measured
by the Pathfinder lander on the martian surface. Oscillations in measured
pressure during a day are caused by the warming/expansion of the atmosphere
which follows the sun around the planet and the cooling/contraction which
follows the night. Similar atmospheric processes occur on Earth. We interpret
the observed variations to indicate the presence of suspended dust over
a large portion of the planet and mixed upwards to several tens of kilometers
in depth. |
 Measured wind direction
ss019.jpg
 |
 Qualitative wind speed
ss020.jpg
 |
| Wind direction at the Mars Pathfinder site is indicated
as the direction from which the wind is coming: i.e. a southerly wind is
a wind from the south. During the initial sols of the mission, wind direction
rotated in a clockwise manner with time: southerly at night, westerly in
the morning, northerly during early afternoon, and from the east in the
evening. Winds from the south at night are consistent with flow down the
Ares Valley at whose northern end Pathfinder is located. The change in the
daily wind variation seen to begin late on sol 7 occurs in conjunction with
an apprent change in the measured surface pressure. We continue to analyze
these changes. |
Wind speeds have still not been absolutely determined
from the signals we are receiving from the wind sensor located at the top
of the ASI/MET mast. However, our wind sensor signals are strong, and do
provide some qualitative information about wind speed (i.e., when are the
winds apparently strongest...). During the mission's initial 10 sols, winds
were strong during early morning hours. The time around noon also was a
preferred time for relatively strong winds. Weakest winds occur during late
afternoon/early evening on most sols. |
|
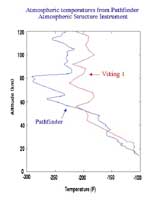
Atmospheric temperatures from the Mars Pathfinder Atmospheric
Structure Instrument: This figure presents a preliminary evaluation
of the atmospheric temperature structure encountered by Mars Pathfinder
during its descent through the Martian atmosphere on July 4, 1997. The deceleration
of the probe during its entry is directly related to atmospheric density.
Pressures and temperatures can be derived from the density using well-established
physical principles. The Atmospheric Structure Instrument measured the probe's
deceleration using high precision accelerometers. The temperature profile
measured by the Viking 1 lander during its descent to the surface of Mars
on July 20, 1976 is shown for comparison. A key debate in the Martian atmospheric
sciences community has been over whether Martian climate has changed significantly
since the era of the Viking missions. The issue has been whether the lower
and middle atmosphere of Mars (altitudes less than 50 km) are "cold"
relative to Viking or whether they are "warm" as at the time of
Viking. The temperature profile in this figure shows the upper atmosphere
of Mars to be quite cold relative to Viking. In fact at about 80 km altitude,
the temperature is the lowest ever measured on Mars-- a brisk -275 degrees
Fahrenheit. The cold temperatures in this region are not surprising since
Mars Pathfinder entered the atmosphere at 3 AM Mars Local Time when the
upper atmosphere cools due to the lack of solar heating. Below 60 km altitude,
the temperatures measured by Pathfinder are quite close to those measured
by Viking. Therefore, the measurements by Mars Pathfinder, which represent
one slice through the atmosphere at one location and time, show that the
atmosphere is "warm" as it was at the time of Viking.
 Atmospheric temperatures
t_profile.jpg
 |
|
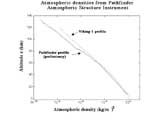
Atmospheric densities from the Mars Pathfinder Atmospheric
Structure Instrument: This figure presents a preliminary evaluation of the
atmospheric density structure encountered by Mars Pathfinder during its
descent through the Martian atmosphere on July 4, 1997. The deceleration
of the probe during its entry is directly related to atmospheric density.
The Atmospheric Structure Instrument measured the probe's deceleration using
accelerometers and these measurements were used in the derivation of this
density profile. The density profile measured by the Viking 1 lander during
its descent to the surface of Mars on July 20, 1976 is shown for comparison.
Atmospheric densities above 60 km altitude at the time of the Mars Pathfinder
entry are much lower (up to about a factor of 5) than at the time of the
Viking 1 entry. These observations of upper atmospheric densities will be
important in planning the aerobraking maneuver to put the Mars Global Surveyor
spacecraft in its intended orbit starting in September 1997. The densities
at lower altitudes also appear to be somewhat lower than those at the time
of Viking. Further analysis of these observations will allow the determination
of the variation of temperature with altitude. These results provide valuable
detailed information on the Martian climate and by comparison with Viking
results can provide information on the variation with time of the Martian
atmosphere.
 Atmospheric densities
ss010.jpg
 |
|
 Viking 1 Lander and Pathfinder atmospheric pressure
ss007.jpg
 |
 Viking 1 Lander and Pathfinder air temperature
ss008.jpg
 |
 Viking 1 Lander and Pathfinder wind direction
ss009.jpg
 |
| The Mars Pathfinder ASI/MET experiment is measuring the atmospheric pressure
at the Martian surface. The pressures measured during the first three Martian
days (Sols) of the mission have average values near 6.75 millibars. Typical
sea-level pressures on Earth are about 150 times larger (1013.25 millibars).
The Pathfinder pressures are 10 to 20% smaller than those recorded 21 years
ago during the same Martian season (middle northern hemisphere summer) by
the Viking Lander 1. These differences may result from differences in the
elevations of the Pathfinder and Viking 1 landing sites. Despite these differences,
the Pathfinder and Viking 1 pressure measurements display a similar daily
cycle, with minimum pressures near 4AM and 6PM, and maximum values near
midnight and 10AM. These daily pressure variations are due primarily to
the atmosphere's response to daytime heating and nighttime cooling. The
much finer resolution of the Pathfinder measurements (one one-thousandth
of a millibar) will aid in studies of small scale weather phenomena which
have small pressure signatures. |
The Mars Pathfinder Lander measures air temperature with sensors located
on the Meteorological mast at 10, 20, and 40 inches, (0.25, 0.50, 1.0 meters)
above the solar panel. Air temperatures measured during the first three
days of the mission show an afternoon high near +14 degrees Fahrenheit (264
Kelvin). [The 270 degree Kelvin temperatures measured at noon on Sol 1 were
obtained while the mast was still lying down just above a warm solar panel].
During the day, the air temperatures measured by the lowest of the 3 sensors
are 9 to 10 degrees Fahrenheit (5 to 6 Kelvin) warmer than those measured
by the top sensor because the atmosphere is heated by the sunlit surface
below it. At night, the ground cools more quickly than the atmosphere, and
the warmest air temperatures are measured by the uppermost temperature sensor.
These temperature differences provide information about the exchange of
heat between the surface and the atmosphere. The Viking landers could not
determine this quantity directly because they measured the air temperature
at only one height (64 inches or 1.6 meters). The air temperatures measured
by Pathfinder are slightly warmer than those seen 21 years ago at the nearby
Viking Lander 1 site at the same Martian season. This may result because
the somewhat darker surface at the Pathfinder landing site absorbs more
sunlight than the Viking 1 Landing site. |
The Mars Pathfinder Atmospheric Structure/Meteorology Experiment measures
wind speed and direction with a sensor mounted on the top of the 40-inch
(1 meter) tall meteorology mast. Measurements made during the late evenings
and early mornings of the second and third Sols after landing indicate prevailing
winds from the south-south-east. The wind direction then changed in the
early afternoon, such that the prevailing winds blew from the north to north-east.
These results are similar to those obtained by the Viking Lander 1 at this
season. Wind speeds have not yet been precisely determined, but early estimates
show that the winds are quite light (a few miles per hour) during the day,
and somewhat stronger (about 10 miles per hour, or 16 kilometers per hour)
at night. |
|

Viking Lander 1 and Pathfinder air temperatures
ss004.jpg |

Viking Lander 1 and Pathfinder atmospheric pressure
ss005.jpg |

Viking Lander 1 and Pathfinder wind direction
ss006.jpg |
| Air temperatures measured by the Mars Pathfinder Lander
during the first two days of the mission show an afternoon high near +9
degrees Fahrenheit (260 Kelvin). [The 270 degree Kelvin temperatures measured
at noon on Sol 1 were obtained while the mast was still lying down just
above a warm solar panel]. During the day, the air temperatures measured
by the lowest of the 3 sensors on the meterology mast are 9 to 10 degrees
Fahrenheit (5 to 6 Kelvin) warmer than those measured by the top sensor
because the atmosphere is heated by the sunlit surface below it. These temperature
differences provide information about the exchange of heat between the surface
and the atmosphere. The Viking landers could not determine this quantity
directly because they measured the air temperature at only one height. The
air temperatures measured by Pathfinder are slightly warmer than those seen
at the nearby Viking Lander 1 site at the same season. This may result because
the somewhat darker soil at the Pathfinder landing site may absorb more
sunlight than the Viking 1 landing site. We hope to obtain morning minimum
temperature measurements in the early hours of Sol 3. |
The Mars Pathfinder ASI/MET experiment is measuring
the atmospheric pressure on the Martian surface. Pressures measured during
the first two Martian days (sols) of the mission average 6.9 millibars.
This pressure can be compared to the average sea-level pressure on Earth
of 1013 millibars. Daily variations are very similar to those measured by
the Viking 1 lander 21 years ago at the same Martian season (middle northern
hemisphere summer). The daily variations in pressure are due in part to
the atmosphere's response to daytime heating and nighttime cooling. One
distinction between the Pathfinder and Viking lander 1 pressure measurements
is the finer resolution provided by Pathfinder, which allows for the determination
of very small differences in pressure (one one-thousandth of a millibar).
This will aid in studying small scale weather phenomena which have small
pressure signatures. |
Mars Pathfinder's measurements of wind direction and
speed suggest values quite similar to those measured by Viking Lander 1
at this season. Afternoon wind directions at the Mars Pathfinder landing
site show winds blowing from the southwest (from 230 degrees) during early
afternoon and then turning to the northwest and then to the north (from
350 degrees) by 3 PM local Mars time. Wind speeds have not yet been definitively
determined, but initial indications are that the winds are quite light (a
few miles per hour) near noon but increase as the afternoon progresses and
might attain values of 10-15 miles per hour. Stay tuned for our first well
determined wind speeds... |
|
 Viking 1 Lander and Pathfinder atmospheric pressure
ss002.jpg
 |
 Viking 1 Lander and Pathfinder atmospheric temperature
ss003.jpg
 |
| This figure compares preliminary atmospheric surface pressures recorded
by the Pathfinder MET experiment with pressures acquired at the same season
and time of day by the Viking 1 lander. Pressure is given in millibars and
time is local time of day at the lander site. |
This figure compares preliminary atmospheric temperatures recorded by the
Pathfinder MET experiment with temperatures acquired at the same season
and time of day by the Viking 1 lander. Temperature is given in Kelvin and
time is local time of day at the lander site. |
|
 Pathfinder deceleration -Atmospheric entry
ss000.jpg
 |
 Pathfinder deceleration -Atmospheric entry
ss001.jpg
 |
| This figure shows the entry vehicle deceleration in g's along its flight
path during the entry phase of the mission. As the probe enters at 7.5 km/second,
the deceleration forces produced by the atmosphere range from less than
10 micro g at time 0 (160 km) to about 20 g at 100 seconds (25 km). The
deceleration pulse produced by parachute deployment is clearly seen at 185
seconds (10 km). |
This figure shows entry vehicle deceleration in g along its flight path
during the entry phase of the mission. Deceleration is plotted in logarithmic
coordinates to reveal accelerations in the range 0.00001 to 20 g. These
measurements allow the atmospheric density, pressure and temperature profiles
to be calculated. |
|