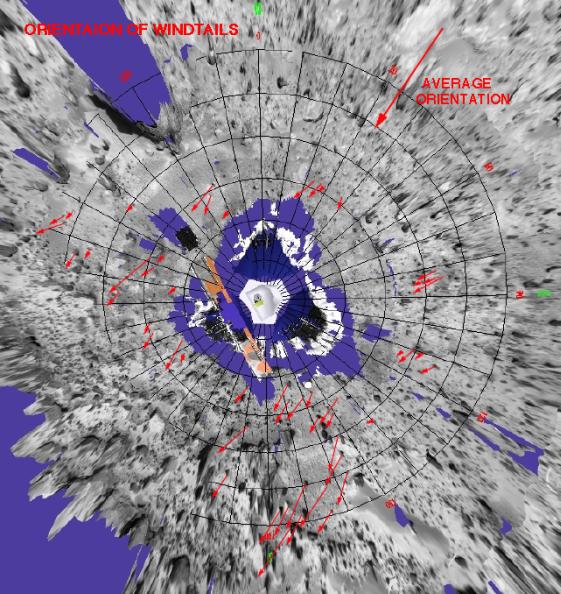
This is a representation of sediment tails noted at the Mars Pathfinder landing site. The arrows in the figure represent the inferred downwind direction, based on our understanding of the deposition of very fine sediment around surface rocks. The inferred wind direction therefore, is from the northeast blowing toward the southwest. This wind trend matched that of light and dark "streaks" of sediment in and around Martian craters in the region that have were seen by the Viking spacecraft. The detailed map was prepared by Mars Pathfinder scientists from Arizona State University on a base image created by MPF scientists from the NASA Ames research facility.
Image Note: MRPS85046 101497_10 WINDTAIL.VECTORS.JPG (replaces MRPS84857)

This image, prepared by Pathfinder scientists at NASA/ Ames Research Center, is a view of the landing site from above. Seen in the lower right is Mermaid dune, with its long axis oriented northwest- southeast and its steeper side, the presumed slipface, toward the southwest. Dunes like Mermaid, the depositional tails and erosional moats associated with rocks in the area, and the fluted and polished surfaces on several boulders at the landing site all indicate an effective wind that blows from the northeast to the southwest.
Image Note: MRPS84915 100997_1 blank-site-map.jpg
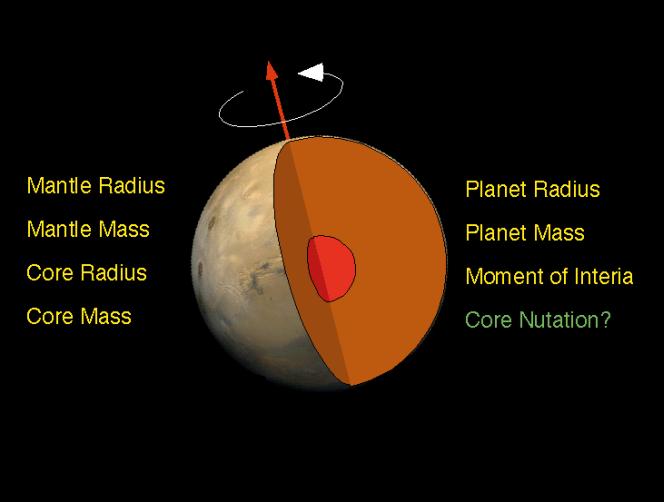
The interior of Mars is simply modeled as a core and mantle with a thin crust, similar to Earth. Mars' size and total mass have been determined by previous missions. Given four parameters, the core size and mass, and mantle size and mass can be determined. The combination of Pathfinder Doppler data with earlier data from the Viking landers has determined a third parameter, the moment of inertia, through measurement of Mars' precession rate. A fourth measurement is needed to complete the interior model. This may be achieved through future Doppler tracking of Pathfinder, since the presence of a fluid core may be detectable through its effect on Mars' nutation. The determination of the moment of inertia is a significant constraint on possible models for Mars' interior. If the core is as dense as possible (i.e. completely iron) and the mantle is similar to Earth's (or similar to the SNC meteorites thought to originate on Mars) then the minimum core radius is about 1300 km. If the core is made of less-dense material (i.e. a mixture of iron and sulfur) then the core radius is probably no more than 2000 km.
Image Note: MRPS85021 101497_1 mars.interior.gif (replaces MRPS84916)
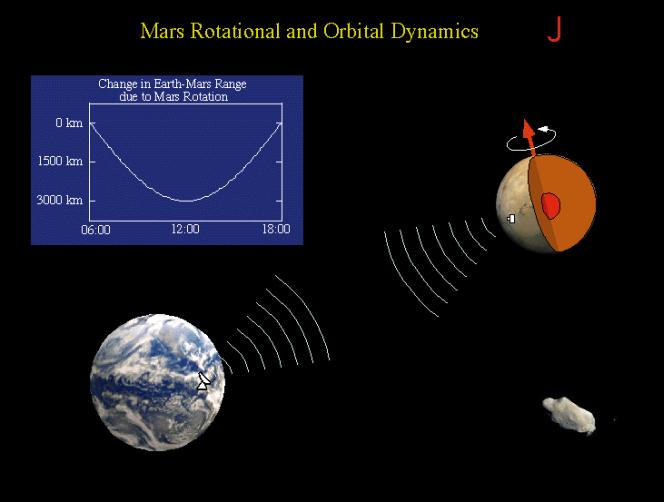
The Rotation and Orbit Dynamics experiment is based on measuring the Doppler range to Pathfinder using the radio link. Mars rotation about it's pole causes a signature in the data with a daily minimum when the lander is closest to the Earth. Changes in the daily signature reveal information about the planetary interior, through its effect on Mars' precession and nutation. The signature also is sensitive to variations in Mars' rotation rate as the mass of the atmosphere increases and decreases as the polar caps are formed in winter and evaporate in spring. Long term signatures in the range to the lander are caused by asteroids perturbing Mars' orbit. Analysis of these perturbations allows the determination of the masses of asteroids.
Image Note: MRPS85022 101497_2 mpf.rotation.gif (replaces MRPS84917)
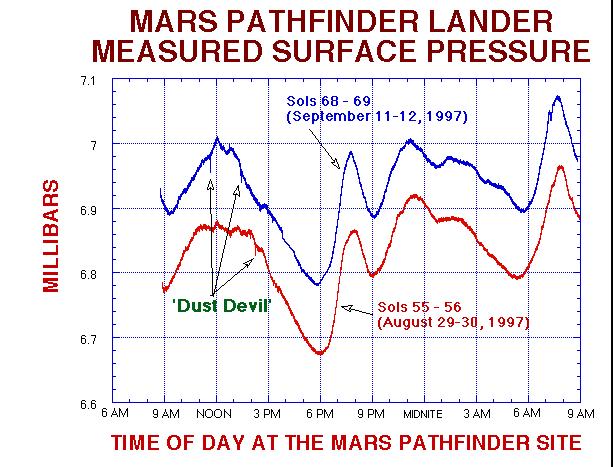
Here is a comparison of the most recent 24-hour met sessions. Note the general trend of increasing pressure with time into the mission. This indicates that the South polar cap is reducing, freeing C02 into the atmosphere. Also note small pressure features around noon, which we think are "dust-devils."
Image Note: MRPS85023 101497_3 MPF_PrcConf_Oct97.PRES.gif (replaces MRPS84918)
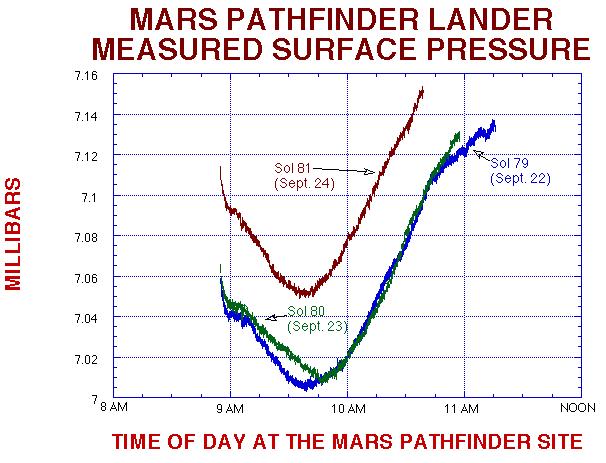
In this figure you can see a significant increase in pressure on Sol 81. This is an indication of a frontal system has moved across the landing sight.
Image Note: MRPS85024 101497_4 MPF_Pres_Conf_P79-81.gif (replaces MRPS84919)
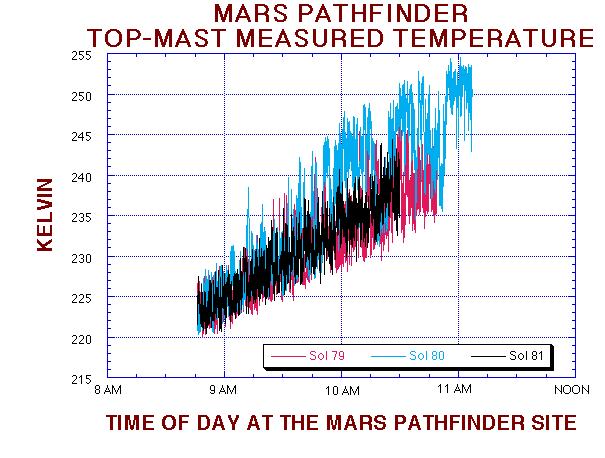
This temperature figure shows the change in the mean and variance of the temperature fluctuations at the Pathfinder landing site. Sol 79 and 80 are very similar, with a significant reduction of the mean and variance on Sol 81. The science team suspects that a cold front has past of the landing sight between Sols 80 and 81.
Image Note: MRPS85025 101497_5 MPF_PrsCnf_TEMP.gif (replaces MRPS84920)

This figure compares the most recent temperature profile derived from the Pathfinder ASI accelerometer data during entry, with the Viking 1 entry profile. The nominal profile is given by the solid red line and the thin red lines represent error estimates. Also shown is the temperature profile (Green) for which the saturated vapor pressure of CO2 is equal to the atmospheric pressure. At 80 km, the Pathfinder entry profile falls below the CO2 profile, and it is possible that CO2 ice clouds could form at this level. This profile also shows a temperature inversion at 10-12 km, which may mark the location of the water vapor ice clouds seen in the IMP camera sunrise images.
Image Note: MRPS84612 092897_1 TvsZ_Schofield.jpg Tim Schofield: (replaces 83643)
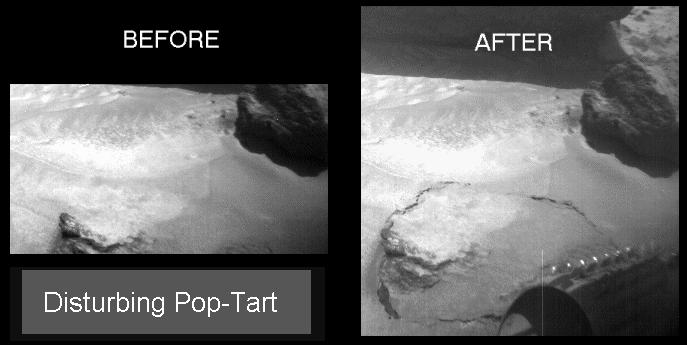
The Sojourner rover's front right camera imaged Pop- tart, a small rock or indurated soil material which was pushed out of the surrounding drift material by Sojourner's front left wheel during a soil mechanics experiment.
Image Note: MRPS83633 082697_11 Poptart.gif

Details of one of Pathfinder's deflated airbags adjacent to a lander petal are prominent in this image, taken by the Imager for Mars Pathfinder (IMP). The blue tiles on top of the petal are solar cells that are used to give power to the lander.
Image Note: MRPS81960 072197_16 d14-i24-c21-Nr.{red,grn,blu}
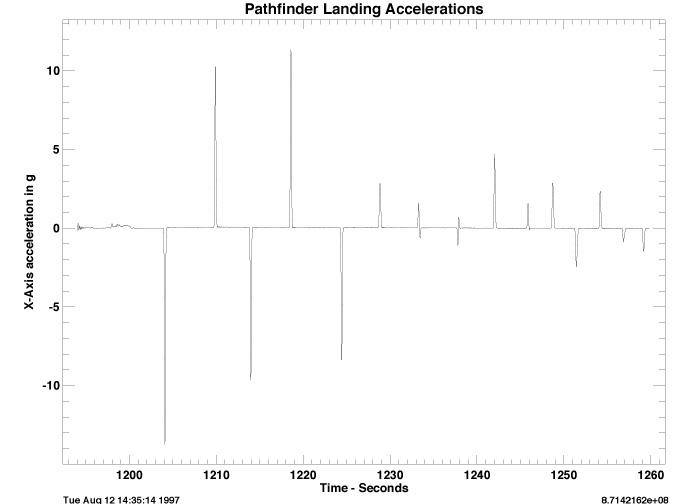
This figure shows RSS acceleration from the three Pathfinder science accelerometers plotted as a function of time during the Pathfinder spacecraft landing. Specific features are airbag deployment (1194 seconds), RAD motor firing (1198 seconds), the cutting of the bridal (1200 seconds), the first bounce (1204 seconds), and the second bounce (1210 seconds). 15 bounces are clearly shown before the high rate (32 Hz) data sampling period ends. Pathfinder is thought to have bounced and rolled for another 1 minute before coming to rest. The height of the peak shows how hard the lander bounced, and the time between peaks shows how high the bounce was. (For example 6 seconds = 16.7 m, 5 seconds = 11.6 m, 4 seconds = 7.4 m, 3 seconds = 4.2 m, and 2 seconds = 1.9 m.)
Image Note: MRPS83159 081397_1 Aug8_prcon_Schofield_F1.jpg
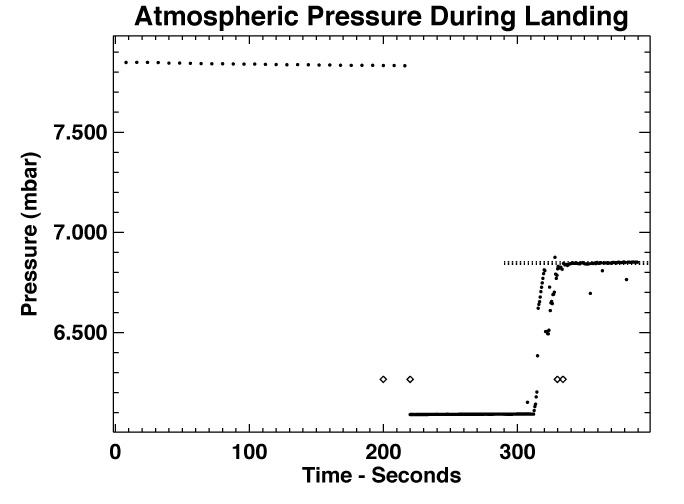
This figure shows the variation with time of pressure (dots) measured by the Pathfinder MET instrument during the landing period shown in image PIA00797. The two diamonds indicat the times of bridal cutting and 1st impact. The overall trend in the data is of pressure increasing with time. This is almost certainly due to the lander rolling downhill by roughly 10 m. The spacing of the horizontal dotted lines indicates the pressure change expected from 10 m changes in altitude. Bounces may also be visible in the data.
Image Note: MRPS83160 081397_2 Aug8_prcon_Schofield_F2.jpg
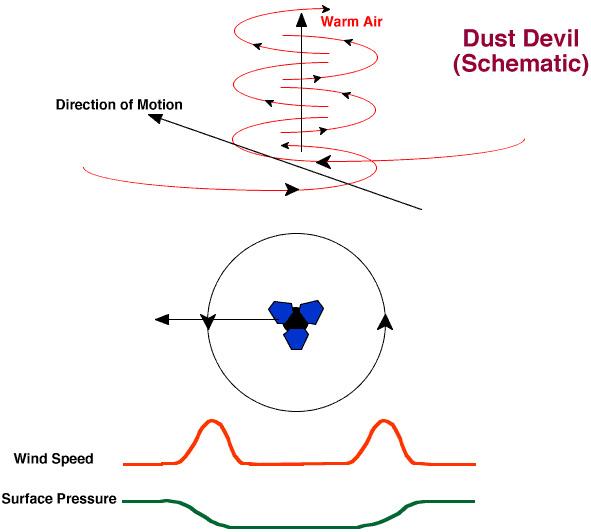
This graphic illustrates the wind pattern in a dust devil, and presents the characteristic pressure and wind speed signatures expected if a dust devil were to pass directly over the lander. A dust devil is driven by warm air rising from the surface which is heated by the sun. If one passes over the lander, strong winds are expected first from one direction and then from the opposite direction. Surface pressure should also fall to a minimum at the center of the dust devil.
Image Note: MRPS83161 081397_3 Aug8_prcon_Schofield_F3.jpg
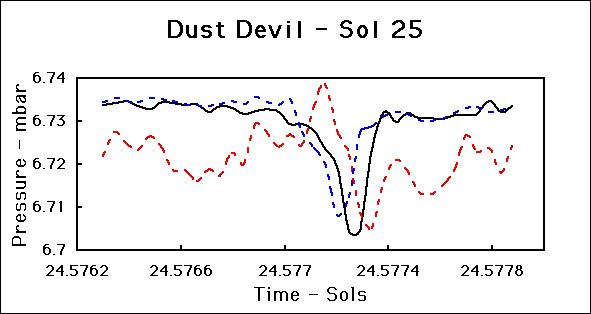
This figure shows the signature of a dust devil that passed over the Pathfinder Lander on Sol 25. Since then we have seen several similar features. The black line shows surface pressure plotted over a period of approximately two minutes. The sharp minimum approximately 0.5% below the background pressure is very clear. The dashed curves show raw data from two hot wire wind sensor elements (Blue = Wind Sensor 4 = East Wind, Red = Wind Sensor 1 = West Wind). When the wind blows directly on an element it cools. It is clear from the figure that the East wind increases suddenly as the dust devil approaches the lander and the pressure begins to fall. As the dust devil passes over the lander, pressure begins to rise, the East wind dies away and the West wind increases suddenly. Finally as the dust devil moves away, pressure returns to normal and the West wind dies away. This is a textbook dust- devil signature.
Image Note: MRPS83162 081397_4 Aug8_prcon_Schofield_F4.jpg
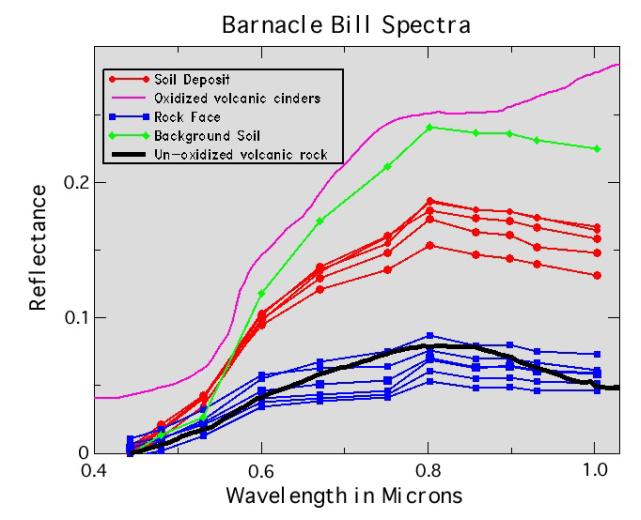
These IMP spectra show the characteristics of the rock surface measured by the Alpha Proton X-Ray Spectrometer (blue), the soil trapped in pits on the rock surface (red), and the deposit of bright drift on the top of the rock. The area measured by the APXS has the properties expected for nearly unweathered igneous rock, and the soil trapped in the pits is intermediate to the unweathered rock and the highly weathered drift material.
Image Note: MRPS81861 071897_4 barnaclespectra.jpg
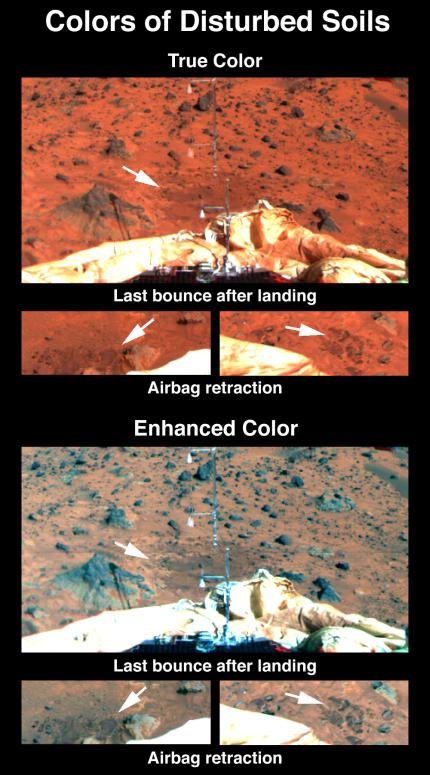
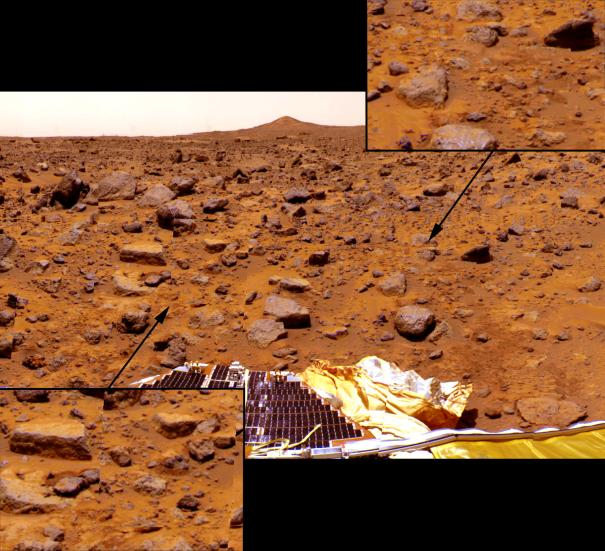
Disturbance of the drift at the Pathfinder landing site reveals a shallow subsurface that is slightly darker but has similar spectral properties. The top set of images, in true color, shows the soils disturbed by the last bounce of the lander on its airbags before coming to rest and the marks created by retraction of the airbags. In the bottom set of images color differences have been enhanced. The mast at center is the Atmospheric Structure Instrument/Meteorology Package (ASI/MET). The ASI/MET is an engineering subsytem that acquired atmospheric data during Pathfinder's descent, and will continue to get more data through the entire landed mission. A shadow of the ASI/MET appears on a rock at left.
Image Note: MRPS81936 072197_1 disturbed.jpg
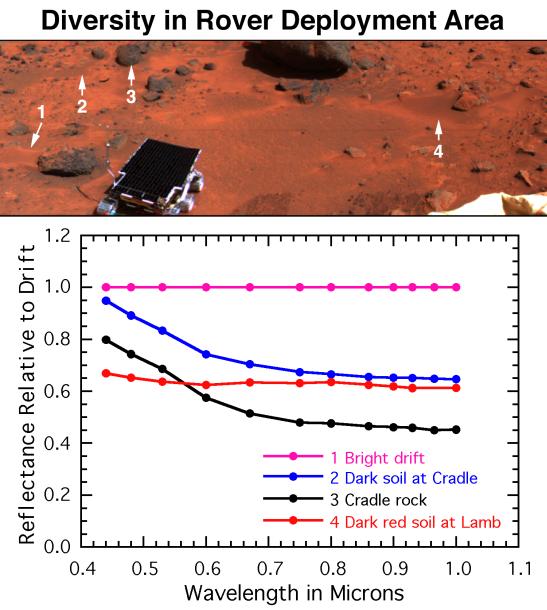
The surface near the rover's egress from the lander contains bright red drift (#1), dark gray rocks such as Cradle (#3), soil intermediate in color to the rocks and drift (#2), and dark red soil on and around the rock Lamb (#4). Globally, Mars is characterized by similar color variations. The spectra of these sites have been ratioed to the drift to highlight their differences. The rocks are less red and have less of a bend in the spectrum at visible wavelengths, indicating less ferric minerals and a more unweathered composition than drift. The intermediate colored soils appear intermediate in the spectral properties as well. The dark red soil at Lamb is darker than drift by about equally as red; the curvature of sppectrum at visible wavelengths indicates either more ferric minerals or a larger particle size.
Image Note: MRPS81940 072197_2 diversity.tiff
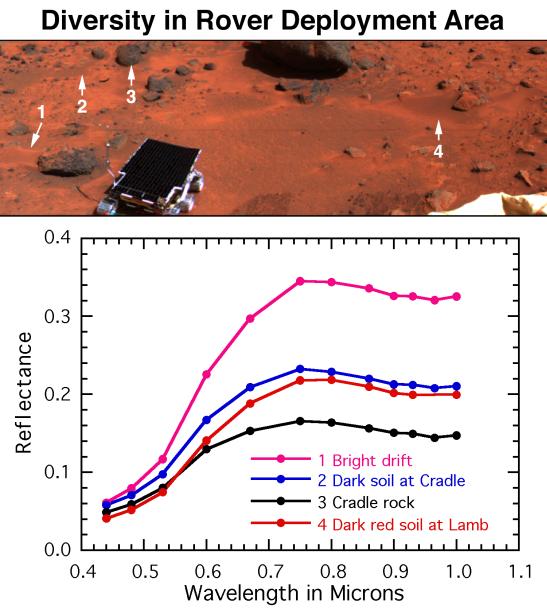
The surface near the rover's egress from the lander contains mainly bright red drift (#1), dark gray rocks such as Cradle (# 3), soil intermediate in color to the rocks and drift (#2), and dark red soil on and around the rock Lamb (#4). Globally, Mars is characterized by similar color variations. The spectra, measured using the full 13-color capability of the Imager for Mars Pathfinder (IMP), provide evidence for the mineralogy of the unweathered rocks and highly weeathered red soils. < P> Mars Pathfinder is the second in NASA's Discovery program of low-cost spacecraft with highly focused science goals. The Jet Propulsion Laboratory, Pasadena, CA, developed and manages the Mars Pathfinder mission for NASA's Office of Space Science, Washington, D.C. JPL is an operating division of the California Institute of Technology (Caltech).
Image Note: MRPS81942 072197_3 diversity2.tiff
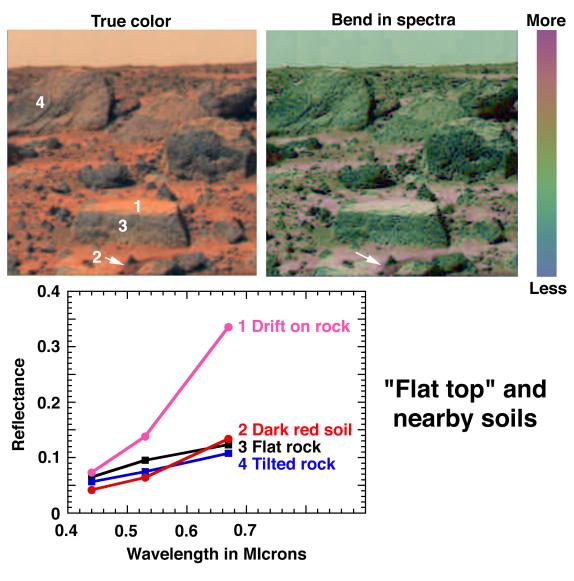
The first color panorama returned by the Imager for Mars Pathfinder (IMP) after Mars Pathfinder's landing included several larger, gray rocks, bright red dust on a flat-topped rock and the ground between the rocks, and darker red soil exposed where Pathfinder's landing dislodged a small rock. The rock dubbed "Flat Top" is at the low center of the images. The less red color and low reflectance of the rocks is consistent with the iron minerals found in igneous rocks, whereas the fine, bright drift has a spectrum indicative of a weathering product. The strength of the bend, or "kink", in the spectrum is related to the abundance and particle size of specific crustalline, ferric weathering products. In the false color image, the blue areas have a weak kink and are relatively unweathered, whereas the red areas' strong kink indicates an abundance of ferric iron minerals.
Image Note: MRPS81943 072197_4 ftarea.tiff
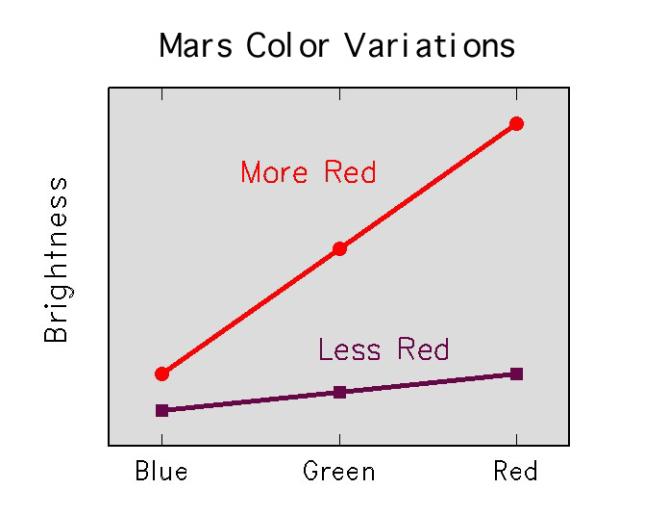
Rocks and soils on the surface are thought to be composed of minerals similar to those found on earth's surface. One of the most important tools for recognizing these minerals is the spectrum of sunlight reflected by them. At the visible and near-infrared light wavelengths measured by the Imager for Mars Pathfinder (IMP), the most important coloring materials in the Martian surface are iron minerals. There are two broad classes of iron minerals. Minerals which occur in igneous rocks (such as pyroxene) have a relatively flat spectrum and they reflect only a small amount of light; they are said to have a low reflectance. Ferric iron minerals, which occur as weathering products, reflect longer-wavelength light and absorb short-wavelength light, hence their very red color. The relative brightnesses of Martian surface materials in IMP's different wavelength filter is a powerful tool for recognizing the iron minerals present.

The shapes of the spectra of surface materials can easily be measured from multispectral images. Measures of surface spectral properties can also be shown as false color overlain on an image to summarize spectral variations near the lander at a glance. The top image shows the region southeast of the lander in true color. In the bottom image of the same region, the strength of the kink in the spectrum at visible wavelengths (related to the abundance and particle size of weathered ferric iron minerals) is shown in false color. Blue rocks are the least weathered, red soils are most weathered, and green soils and rock faces show an intermediate state of weathering. The Atmospheric Structure Instrument/Meteorology Package (ASI/MET) is the mast and windsocks at left. The metallic object at lower right is a portion of the lander's low-gain antenna.
Image Note: MRPS81945 072197_6 specmap.tiff
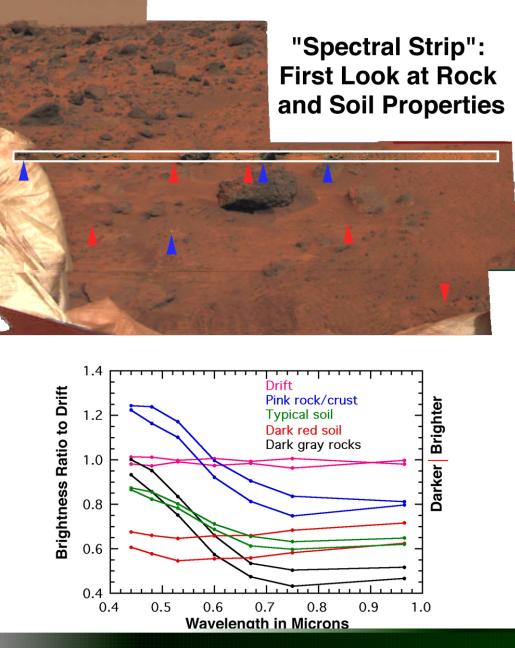
The earliest survey of spectral properties of the rocks and soils surrounding Pathfinder was acquired as a narrow strip covering the region just beond the where the rover made its egress from the lander. The wavelength filters used, all in the binocular camera's right eye, cover mainly visible wavelengths. These data reveal at least five kinds of rocks and soil in the immediate vicinity of the lander. All of the spectra are ratioed to the mean spectrum of bright red drift to highlight the differences. Different occurrences of drift (pink spectra) are closely similar. Most of the rocks (black spectra) have a dark gray color, and are both darker and less red than the drift, suggesting less weathering. Typical soils (green spectra) are intermediate in properties to the rocks and drift. Both these data and subsequent higher resolution images show that the typical soil consists of a mixture of drift and small dark gray particles resembling the rock. However, two other kinds of materials are significantly different from the rocks and drift. Pinkish or whitish pebbles and crusts on some of the rocks (blue spectra) are brighter in blue light and darker in near-infrared light than is the drift, and they lack the spectral characteristics closely associated with iron minerals. Dark red soils in the lee of several rocks are about as red as the drift, but consistently darker. The curvature in the spectrum at visible wavelengths suggests either more ferric iron minerals than in the drift or a larger particle size.
Image Note: MRPS81946 072197_7 specstrip.jpg

Another early target for the full-color capability of the Imager for Mars Pathfinder (IMP) was the rock Stripe, named for the vertical, red band on its face. Regions with different color properties include the rock face (blue), bright soil in the background (green), darker intermediate colored soil in front of the rock (red), and the vertical stripe.
Image Note: MRPS81947 072197_8 stripe_3color.JPG
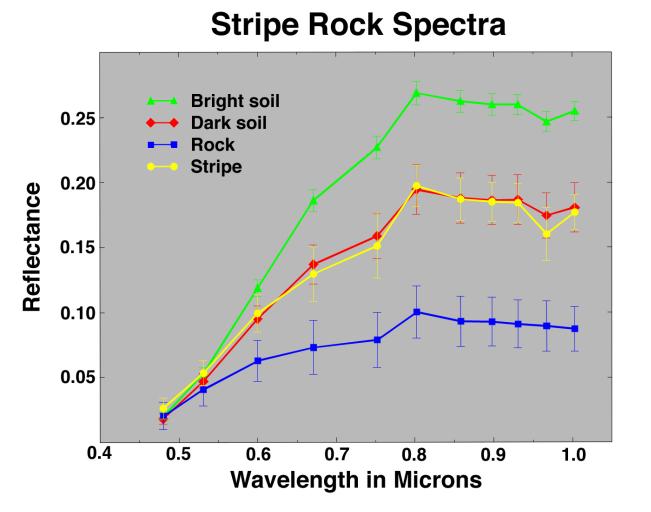
These spectra, color coded to image #81947 of the rock Stripe, compare color features on the rock with the surrounding soil. Intermediate-colored darker soil in front of the rock (red) is intermediate in its spectral properties to the relatively unweathered rock face (blue) and the bright red soil forming the drift (green). The vertical stripe on the rock face closely resembles the dark intermediate soil, suggesting that the stripe may result from trapping of drift material in a fracture in the rock.
Image Note: MRPS81948 072197_9 stripespectra.jpg

The rover Sojurner's first target for measurement by the Alpha-Proton-Xray Spectrometer (APXS) was the rock named Barnacle Bill, located close to the ramp down which the rover made its egress from the lander. The full spectral capability of the Imager for Mars Pathfinder (IMP), consisting of 13 wavelength filters, was used to characterize the rock's surface. The measured area is relatively dark, and is shown in blue. Nearby on the rock surface, soil material is trapped in pits (shown in red).
Image Note: MRPS81949 072197_10 barnacle_3color.jpg
Looking east from the lander, the last few bounce marks as Pathfinder rolled to a stop on July 4 are visible in the soil in this image, taken by the Imager for Mars Pathfinder (IMP). The two most distant marks, identified by pointers in the image, consist of dark patches of disturbed soil. The three closest marks are clearly visible in the foreground, with one easily identifiable behind the Atmospheric Structure Instrument/Meteorology Package (ASI/MET) mast, is at lright. The most distant positively identified bounce mark, indicated by the pointer at right, is approximately 11.3 meters (37 feet) from the lander.
Image Note: MRPS81991 072197_23 EastBounces.jpg
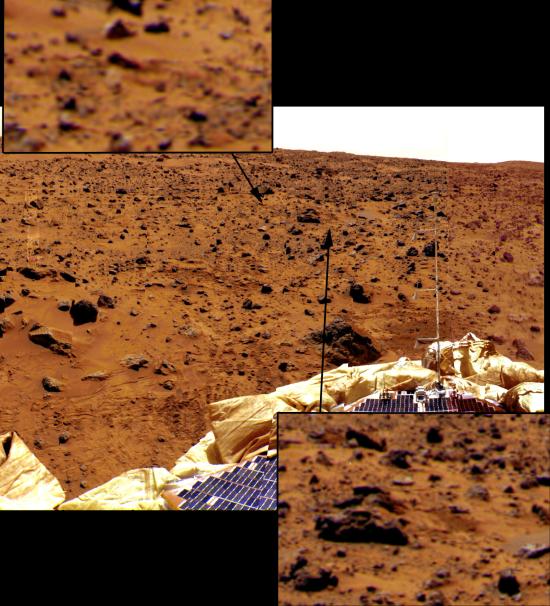
Looking southwest from the lander, soil disturbances indicating the spacecraft rolled through the landing site are visible. Arriving from the east, the lander, still encased in its protective airbags, rolled up a slight rise and then rolled back down to its final position. The inset at left shows displaced rocks near the rock "Flat Top." Dark patches of disturbed soil indicate where the rocks had originally rested Both insets show rocks that were pushed into the soil from the weight of the lander, visible from the areas of raised rims of dark, disturbed soil around several rocks. The south summit of Twin Peaks is in the background, while a lander petal, deflated airbag, and rear rover deployment ramp are in the foreground.
Image Note: MRPS81992 072197_24 WesBounces.jpg

This image, taken by the Viking 1 orbiter in 1976, has been used by scientists to pinpoint the location of the Sagan Memorial Station. The lander is positioned at the center of the blue "rays," and North is at the top. The prominent twin hills dubbed "Twin Peaks" are west of the lander, and the prominent large crater dubbed "Big Crater" is at center. The small crater at the north border of Big Crater, dubbed "Rim Shot Crater," and "Little Crater" were features that helped scientists accurately identify the location of the lander on the Martian surface and are shown in the two insets. The spacecraft landed successfully within its original target ellipse, which measured 100 km (62 mi) by 200km (124mi).
Image Note: MRPS81993 072197_25 Location.jpg
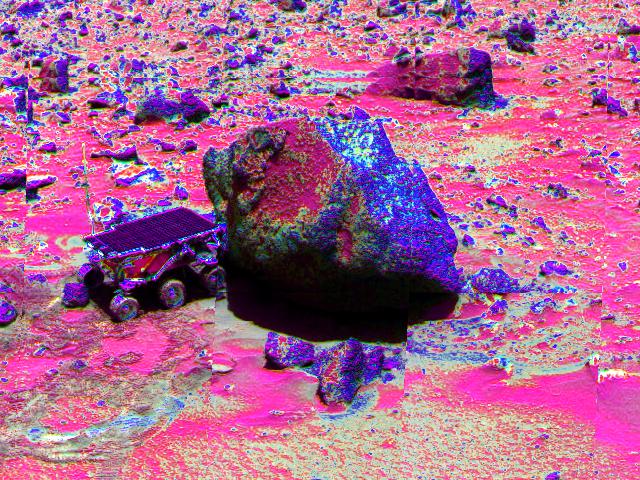
Yogi in False Color
There is not any caption information for this product. This image may have been released in a rapid fashion for public viewing; a caption should be forthcoming
Image Note: MRPS81994 072197_26 false_color.{red,grn,blu}
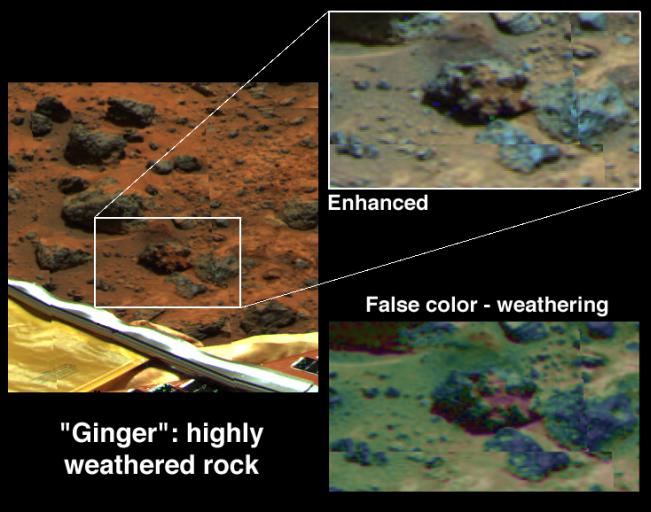
One of the more unusual rocks at the site is Ginger, located southeast of the lander. Parts of it have the reddest color of any material in view, whereas its rounded lobes are gray and relatively unweathered. These color differences are brought out in the inset, enhaced at the upper right. In the false color image at the lower right, the shape of the visible-wavelength spectrum (related to the abundance of weathered ferric iron minerals) is indicated by the hue of the rocks. Blue indicates relatively unweathered rocks. Typical soils and drift, which are heavily weathered, are shown in green and flesh tones. The very red color in the creases in the rock surface correspond to a crust of ferric minerals. The origin of the rock is uncertain; the ferric crust may have grown underneath the rock, or it may cement pebbles together into a conglomerate. Ginger will be a target of future super- resolution studies to better constrain its origin.
Image Note: MRPS82016 072297_1 gingerrock.tiff