schofield_f1.gif (31K) |
schofield_f2.gif (47K) |
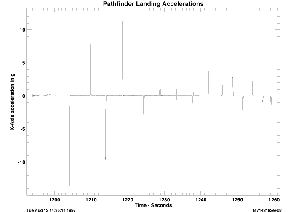
| This figure shows RSS acceleration from the three
Pathfinder science acceleromaters plotted as a function of time during the
Pathfinder spacecraft landing. Specific features are airbag deployment (1194
seconds), RAD motor firing (1198 seconds), the cutting of the bridal (1200
seconds), the first bounce (1204 seconds), and the second bounce (1210 seconds).
15 bounces are clearly shown before the high rate (32 Hz) data sampling
period ends. Pathfinder is thought to have bounced and rolled for another
1 minute before coming to rest. The height of the peak shows how hard the
lander bounced, and the time between peaks shows how high the bounce was
(For example 6 seconds =3D 16.7 m, 5 seconds =3D 11.6 m, 4 seconds =3D 7.4
m, 3 seconds =3D 4.2 m, and 2 seconds =3D 1.9 m). |
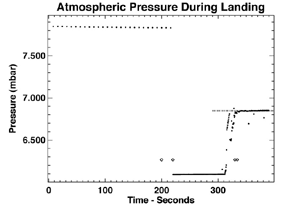
This figure shows the variation with time of pressure
(dots) measured by the Pathfinder MET instrument during landing period of
Figure 1. The two diamonds indicate the times of bridal cutting and 1st
impact. The overall trend in the data is of pressure increasing with time.
This is almost certaily due to the lander rolling downhill by roughly 10
m. The spacing of the horizontal dotted lines indicates the pressure change
expected from 10 m changes in altitude. Bounces may also be visible in the
data. |
schofield_f4.gif (31K) |
dustdevil.gif (31K) |
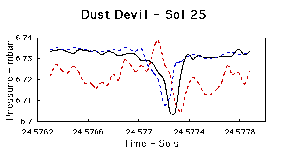
| This figure shows the signature of a dust devil that
passed over the Pathfinder lander on Sol 25. Since then we have seen several
similar features. The black line shows surface pressure plotted over a period
of approximately two minutes. The sharp minimum approximately 0.5% below
the background pressure is very clear. The dashed curves show raw data from
two hot wire wind sensor elements (Blue =3D Wind Sensor 4 =3D East Wind,
Red =3D= Wind Sensor 1 =3D West Wind). When the wind blows directly on an
element it cools==2E. It is clear from the figure that the East wind increases
suddenly as the dust devil approaches the lander and the pressure begins
to fall. As the dust devil passes over the lander, pressure begins to rise,
the East wind dies away and the West wind increases suddenly. Finally as
the dust devil moves away, pressure returns to normal and the West wind
dies away. This is a textbook dust-devil signature. |
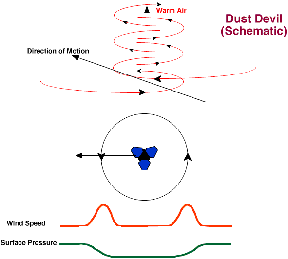
This figure is a very simplified schematic drawing of the dust-devil that
passed over the Sagan Memorial Station on Sol 25. It shows direction of
motion and the graphs of a textbook dust-devil in terms of wind speed and
surface pressure. |
|
|
|
|
|
|
|
|
|
|
|
 hap_1.jpg
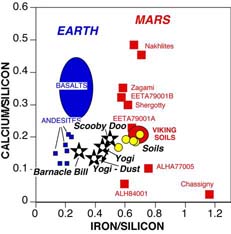
In this diagram, preliminary Pathfinder APXS analyses of soils (yellow
dots) extend the range of Viking soil analyses. The analysis of Yogi appears
to be contaminated by dust adhering to the rock's surface. The rock composition
can be estimated by subtracting a portion of dust; the resulting Yogi composition
is very similar to that of Barnacle Bill (we assumed 50% dust having the
composition of drift analysis A-5 and used a linear mixing model to subtract
the dust which is only strictly valid if the dust, where present, is thicker
than the APXS penetration depth). Barnacle Bill is also contaminated by
dust, but to a lesser extent. |
 hap_2.jpg
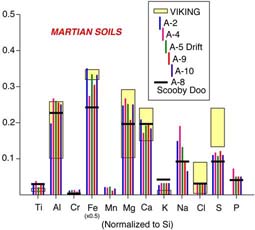
APXS analyses of Martian soils are compared with Viking soil analyses.
Each element is normalized to silicon in this diagram. The yellow boxes
representing Viking data include all analyses and their analytical uncertainties
reported by B.C. Clark and others (1982) Journal of Geophysical Research,
vol. 87, p. 10,064. Although the first APXS soil analysis (A-2) was reported
to be almost identical to Viking soils, ssubsequent analyses demonstrate
some variability and a few significant differences from Viking analyses.
Specifically, soils at the Pathfinder site generally have higher aluminum
and magnesium, and lower iron, chlorine, and sulfur. Scooby Doo, which appears
to be a sedimentary rock composed primarily of compacted soil, also exhibits
a few chemical differences form the surrounding soils. Analysis A-5 represents
a deposit of windblown dust (called drift), whereas the other soil analyses
may be cemented materials. |
 hap_3.jpg
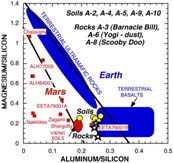
This diagram (preliminary X-ray data) illustrates chemical differences
between terrestrial rocks and meteorites inferred to have been derived from
Mars. The Martian meteorites (as well as Viking soil analyses) all plot
to the left of the fields for Earth rocks. Pathfinder APXS analyses of rocks
(stars) and soils (yellow dots) appear to plot in the gap between these
previously defined fields, although they are similar to at least one basaltic
meteorite. The other two stars represent the compositions of Barnacle Bill
and Yogi. The analysis of Yogi appears to be contaminated by dust adhering
to the rock's surface. The rock composition can be estimated by subtracting
a portion of dust; the resulting Yogi composition is very similar to that
of Barnacle Bill (we have assumed 50% dust having the composition of drift
analysis A-5 and used a linear mixing model to subtract the dust which is
only strictly valid if the dust, where present, is thicker than the APXS
penetration depth). Barnacle Bill is also contaminated by dust, but to a
lesser extent. |
 hap_4.jpg
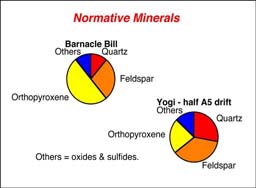
The Pathfinder APXS chemical analyses of Barnacle Bill and Yogi (corrected
for adhering dust) have been recast into plausible minerals using the CIPW
norm calculation. If they are fully crystalline igneous rocks, both possibly
consist of orthopyroxene (magnesium-iron silicate), feldspars (aluminum
silicates of potassium, sodium, and calcium), quartz (silicon dioxide),
and other minerals that include magnetite, ilmenite, iron sulfide, and calcium
phosphate. |
 hap_5.jpg
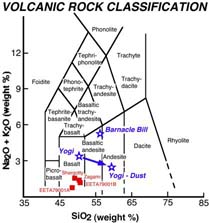
This commonly used chemical classification for lavas shows that Barnacle
Bill and Yogi (corrected for adhering dust) are distinct from basaltic Martian
meteorites (shown as red squares). The Pathfinder APXS analyses have been
corrected fo the presence of a small amount of salt, and sulfur is assumed
to be present as sulfide. These rocks plot in or near the field of andesites,
a type of lava common at continental margins on the Earth. The preliminary
data for alkalis are likely to represent upper limits, so refinement of
these analyses could shift them to slightly lower Na2O + K2O and higher
SiO2. We do not presently know whether these are igneous (crystallized from
a melt), sedimentary (grains/fragments deposited by wind or water or precipitates),
or metamorphic rocks (deformed). |
The upper two images show the lower magnetic properties targets
on sols 6 and 13. The lower image shows the upper magnetic target on sol
26. It is clear that the patterns of dust have developed with time. For
more information on the background on this experiment, please visit the
team's homepage at http://ntserv.fys.ku.dk/mars.htm.
| magnets_sol_26.jpg (109K) |
|
|
|
The preliminary APXS results on Barnacle Bill, Yogi and soil!
|
81940_full.jpg (264K)
81942_full.jpg (264K) |
81943_full.jpg (450K)
81944_full.jpg (31K) |
The surface near the rover's egress from the lander
contains bright red drift (#1), dark gray rocks such as Cradle (#3), soil
intermediate in color to the rocks and drift (#2), and dark red soil on
and around the rock Lamb (#4). Globally, Mars is characterized by similar
color variations. The spectra of these sites have been ratioed to the drift
to highlight their differences. The rocks are less red and have less of
a bend in the spectrum at visible wavelengths, indicating less ferric minerals
and a more unweathered composition than drift. The intermediate colored
soils appear intermediate in the spectral properties as well. The dark red
soil at Lamb is darker than drift by about equally as red; the curvature
of sppectrum at visible wavelengths indicates either more ferric minerals
or a larger particle size.
The surface near the rover's egress from the lander
contains mainly bright red drift (#1), dark gray rocks such as Cradle (#3),
soil intermediate in color to the rocks and drift (#2), and dark red soil
on and around the rock Lamb (#4). Globally, Mars is characterized by similar
color variations. The spectra, measured using the full 13- color capability
of IMP, provide evidence for the mineralogy of the unweathered rocks and
highly weathered red soils. |
The first color panorama returned by IMP after
Mars Pathfinder's landing included several larger, gray rocks, bright red
dust on a flat- topped rock and the ground between the rocks, and darker
red soil exposed where Pathfinder's landing dislodged a small rock. The
less red color and low reflectance of the rocks is consistent with the iron
minerals found in igneous rocks, whereas the fine, bright drift has a spectrum
indicative of a weathering product. The strength of the bend, or "kink",
in the spectrum is related to the abundance and particle size of specific
crustalline, ferric weathering products. In the false color image, the blue
areas have a weak kink and are relatively unweathered, whereas the red areas'
strong kink indicates an abundance of ferric iron minerals.
Rocks and soils on the surface are thought to be
composed of minerals similar to those found on earth's surface. One of the
most important tools for recognizing these minerals is the spectrum of sunlight
reflected by them. At the visible and near-infrared light wavelengths measured
by the Imager for Mars Pathfinder (IMP), the most important coloring materials
in the martian surface are iron minerals. There are two broad classes of
iron minerals. Minerals which occur in igneous rocks (such as pyroxene)
have a relatively flat spectrum and they reflect only a small amount of
light; they are said to have a low reflectance. Ferric iron minerals, which
occur as weathering products, reflect longer-wavelength light and absorb
short-wavelength light, hence their very red color. The relative brightnesses
of Martian surface materials in IMP's different wavelength filter is a powerful
tool for recognizing the iron minerals present. |
81945_full.jpg (93K)
81946_full.jpg (155K)
|
82016_full.jpg (78K)
82018_full.jpg (217K) |
The shapes of the spectra of surface materials
can easily be measured from multispectral images. Measures of surface spectral
properties can also be shown as false color overlain on an image to summarize
spectral variations near the lander at a glance. The top image showns the
region southeast of the lander in true color. In the bottom image of the
same region, the strength of the kink in the spectrum at visible wavelengths
(related to the abundance and particle size of weathered ferric iron minerals)
is shown in false color. Blue rocks are the least weathered, red soils are
most weathered, and green soils and rock faces show an intermediate state
of weathering.
The earliest survey of spectral properties of the
rocks and soils surrounding Pathfinder was acquired as a narrow strip covereing
the region just beond the where the rover made its egress from the lander.
The wavelength filters used, all in the binocular camera's right eye, cover
mainly visible wavelengths. These data reveal at least five kinds of rocks
and soil in the immediate vicinity of the lander. All of the spectra are
ratioed to the mean spectrum of bright red drift to highlight the differences.
Different occurrences of drift (pink spectra) are closely similar. Most
of the rocks (black spectra) have a dark gray color, and are both darker
and less red than the drift, suggesting less weathering. Typical soils (green
spectra) are intermeidate in properties to the rocks and drift. Both these
data and subsequent higher resolution images show that the typical soil
consists of a mixture of drift and small dark gray particles resembling
the rock. However two other kinds of materials are significantly different
from the rocks and drift. Pinkish or whitish pebbles and crusts on some
of the rocks (blue spectra) are brighter in blue light and darker in near-infrared
light than is the drift, and they lack the spectral characteristics closely
associated with iron minerals. Dark red soils in the lee of several rocks
are about as red as the drift, bust consistently darker. The curvature in
the spectrum at visible wavelengths suggests either more ferric iron minerals
than in the drift or a larger particle size. |
One of the more unusual rocks at the site is Ginger,
located southeast of the lander. Parts of it have the reddest color of any
material in view, whereas its rounded lobes are gray and relatively unweathered.
These color differences are brought out in the inset, enhaced at the upper
right. In the false color image at the lower right, the shape of the visible-
wavelength spectrum (related to the abundance of weathered ferric iron minerals)
is indicated by the hue of the rocks. Blue indicates relatively unweathered
rocks. Typical soils and drift, which are heavily weathered, are shown in
green and flesh tones. The very red color in the creases in the rock surface
correspond to a crust of ferric minerals. The origin of the rock is uncertain;
the ferric crust may have grown underneath the rock, or it may cement pebbles
together into a conglomerate. Ginger will be a target of future super- resolution
studies to better constrain its origin.
In this scene showing the rover deployed at Yogi,
the colors have similarly been enhanced to bring out differences. The same
three kinds of rocks are recognized as in the distance. Yogi (red arrow),
one of the large rocks with a weathered coating, exhibits a fresh face to
the northeast, resulting perhaps from eolian scouring or from fracturing
off of pieces to expose a fresher surface. Barnacle Bill and Cradle (blue
arrows) are typical of the unweathered smaller rocks. During its traverse
to Yogi the rover stirred the soil and exposed material from several cm
in depth. During one of the turns to deploy the APXS (inset and white arrow),
the wheels dug particularly deeply and exposed white material. Spectra of
this white material show it is virtually identical to Scooby Doo, and such
white material may underly much of the site. |
|
| closesitevectors.jpg (93K)
|
|
|
The Mars Pathfinder Magnetic Properties
Experiment primarily involves an array of permanent magnets on the lander.
The magnets are assembled to produce a bullseye pattern of attracted dust
using an outer annular ring magnet, 18mm in diameter, surrounding a central
cylindrical magnet. In each of two magnet arrays, five such magnets of progressively
increasing strength, are mounted in magnesium blocks.
These magnets are intended to attract
any magnetic particles in the windborne dust. The picture shows a magnet
array on Sol 6 and on Sol 13. Dust has clearly accumulated on the two strongest
magnets. As more dust is attracted with time, we expect the patterns on
the magnets to become clearer.
| mpe_0718.jpg (109K) |
|
| stripe_3color.jpg (62K) |
stripe_spectra.jpg (47K) |
One of the first "multispectral spots"
obtained by the IMP camera was of the Stripe Rock on Sol 4. A multispectral
spot measurement obtains small images of a region of interest in all geology
filters with no image compression. Stripe rock is of interest to Mars Pathfinder
scientists because of a bright vertical stripe that appears on the center
of the rock face. It was thought that this stripe might be an intruded vein
of material of different composition than the surrounding rock.
The color image of this rock shows that the stripe
is of similar color to the surrounding soils (see arrow). A detailed examination
of the rock was conducted to extract preliminary reflectance spectra (that
is, the variation of brightness with color) from nearby bright and dark
soils, the stripe, and the surrounding rock. Although these data require
further calibration (e.g., the lower reflectance at 965 nm is not reliable
at this time), they do show that the general spectral characteristic of
the stripe is quite similar to the nearby dark soil. This suggests that
the "stripe" is actually an accumulation of soil deposited in
a crack in the rock face.
Mars Pathfinder Mission
Mineralogy and Geochemistry Science Operations Group |
|
Barnacle Bill Rock
Hypothesis: APXS data show composition of rock is consistent with
volcanic andesite, but rough texture of surface suggests it may be a "breccia."
Could it be composed of many different rock fragments that combine to
give a similar overall composition?
Method: Target Barnacle Bill with "multispectral spot" (all
geology filters at full spatial resolution of about 1-2 cm per picture element)
Goal: Determine variability of reflectance spectra (mineralogy) across
the face of the rock
If all spectra are similar: rock is "homogeneous" (composed
of the same material)
If spectra vary: rock may be "heterogeneous" (such as an impact
melt breccia or sedimentary conglomerate)
Result: Spectra taken from many different locations show only two
basic kinds of spectra:
- Soil-like deposits
- Dark rock face
Implication: At spatial resolution of 1-2 cm, rock composition is
homogeneous. However, rock may be composed of fine-grained materials (<
1-2 cm) that cannot be seen with this method. |
| ss013.jpg (388K) |
ss014.jpg (78K) |
| This image shows the location of Barnacle Bill rock
(left of the Sojourner rover) and the approximate location of the full-resolution
"multispectral spot" acquired on Barnacle Bill. Lossless (no compression)
images were taken in all geology filters using the IMP camera to study in
detail the variation of brightness in each filter, which provides information
regarding the mineralogy of the material sampled. Spectra were extracted
from several study regions (shown to the right of the high resolution view).
The green area represents soil found behind the rock. Red patches represent
brighter areas on the rock that are interpreted as accumulations of wind-blown
dust found in small holes, or vesicles, on the rock. Blue patches represent
darker rock faces not contaminated by a soil deposit. The spectra of these
materials are shown in the accompanying figure. |
Preliminary data acquired from the "multispectral
spot" image sequence for Barnacle Bill rock. Images were acquired with
no compression in all geology filters. Reflectance spectra (that is, the
variation of brightness with wavelength, or color) are shown for background
soil (green), soil-like deposits found on and within small holes in the
rock (red), and dark portions of the rock face (blue). Comparison of the
spectra of these three types of materials demonstrates that the rock has
relatively homogeneous composition at the spatial resolution of the patches
sampled (about 1-3 cm). That is, all soil-like deposit and rock face spectra
cluster in both their overall brightness (reflectance) and shape of their
reflectance curves. A more heterogeneous rock would show variable spectral
characteristics across its face. Note that the spectra of the soil-like
deposit is intermediate to that of the background soil and rock face spectra.
This is consistent with the interpretation that the soil-like deposit is
a relatively thin layer in which portions of the rock are also sampled within
the patches selected.
Also shown are laboratory spectra of oxidized and
unoxidized volcanic rocks from Earth. Scientists will compare spectra of
terrestrial materials such as these to help determine the composition of
the rocks observed at the landing site in combination with data returned
by other instruments such as the APXS. |
|
| pr1.jpg (78K) |
pr2.jpg (47K) |
pr3.jpg (512K) |
| In the foreground of each image is "Flat Top". Each frame was
taken by the IMP camera using a different color filter. The color filters
alter the appearance of the image. The red filter has enhanced both the
textures of the rocks and the dust on the surface of "Flat Top". |
The Sojourner rover has successfully navigated the rear deployment ramp.
This high resolution color image shows the front, left portion of the rover.
The micron scale soil beneath the rover was the first specimen examined
by the Alpha Proton X-Ray Spectrometer. |
This image shows the Sojourner rover in its traveling configuration. The
rover has since stood up and driven onto the surface of Mars. The red rectangle
represents the location of the spectral analysis performed by the Imager
for Mars Pathfinder. |
|