MGS Aerobraking Model
Wayne P. Sidney
Planning the aerobraking phase of the Mars Global Surveyor mission is a particularly complicated activity that must integrate the trajectory design with the spacecraft and mission operations system design. While the success of the Magellan aerobraking experience at Venus late last year is extremely valuable, there are significant differences and uncertainties peculiar to the capabilities and characteristics of the MGS spacecraft and the Martian atmosphere. Early on it became apparent that we needed a way to model the effects of the trajectory design on the spacecraft and ground capabilities.
After spending 2 months at Martin Marietta Denver developing the spacecraft command blocks, I was tasked with generating the aerobraking profile model. A preliminary version of the model was required by February 2, the date scheduled for MGS's Aerobraking Peer Review. This gave me 1 month.
The first step in generating such a model required the definition of the spacecraft command blocks, or sets of instructions, required for aerobraking. Two blocks were all that was required. The first would configure and orient the spacecraft for entry into the atmosphere with each periapsis passage, or the point in MGS's orbit that comes closest to Mars. The second would perform a propulsive maneuver at apoapsis (the point in orbit farthest away from Mars) as required to maintain the desired periapsis altitude. Using a popular computer spreadsheet program, I began by setting up a block parameter worksheet, which allowed the user to set the values of the various block parameters used to specify the relative timing between the required spacecraft events. The block parameter worksheet was then linked to the aerobraking trajectory database, from which the absolute event trigger times for the blocks (e.g., periapsis and apoapsis times), as well as the orbital elements and other orbital data (e.g., solar eclipse and earth occultation times, etc.), were extracted.
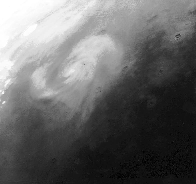
 Martian storm observed by Viking Orbiter 1. JPL-P-20805
I then set up a second worksheet which contained the logic used to generate an actual time-ordered spacecraft command listing, based on the input block parameter values. However, as is the case with predicted events files, it was not easy to visualize what was going on. As the axiom goes, "A picture is worth a thousand words." My next goal then was to present the same data in a timeline format. Within a few days, I had a timeline generator "macro" developed and time bars and event bars were popping up all over the place on my screen!
I next attempted something somewhat more ambitious--drawing the spacecraft events on an orbital plot. Solving Kepler's time-of-flight equation, the model was able to a scaled orbital plot with tic marks and labels placed around the orbit for the spacecraft events.
Within another week I was able to model the power state changes and generate battery depth of discharge charts based on the on-Sun and off-Sun loads and durations for a single or a whole range of orbits. As a result, we now have a tool which allows us to input the aerobraking trajectory design and determine the effects on spacecraft resources. Additionally, it supports the mission operations design by determining critical parameters such as available downlink transmit times for navigation orbit determination and frequency of block parameter updates as the orbit shrinks.
The success of my task demonstrates that extremely powerful, flexible, and user-friendly commercial software can be used to perform the most sophisticated types of modelling and analysis in a very short amount of time. In the current financial environment that NASA and JPL are faced with, it seems that "faster, better, cheaper" is a reality we can all strive for and achieve, in large part because we have inexpensive and accessible tools to work with.
Return to Cover Page


 Martian storm observed by Viking Orbiter 1. JPL-P-20805